Do You Want To Stay Informed About Every Aspect Of Your Business?
GET FREE ACCESS FOR 30 DAYS
Connect your data sources and receive all key insights on autopilot.
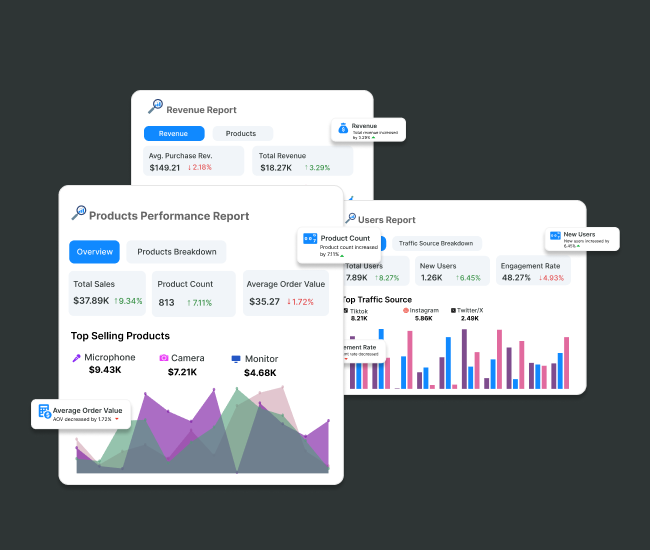
Ecommerce Tracking In Google Analytics 4(GA4)

Supanalyzer
Last Updated: 16th March, 2024 6 Min ReadIf you're not tracking and analyzing your business data you're leaving money on the table for your competitors. Not making data-driven decisions can harm your brand reputation and business growth.
You can track and analyze every aspect of your online business, from product performance and sales to campaign effectiveness using Google Analytics.
GA4 provides all key metrics you need to build a successful business.
If you're not already using GA4, now is the time to do it. Boost your business growth using GA4.
 Supanalyzer
Ecommerce Tracking In Google Analytics 4(GA4)
Tracking Various Users Activities with GA4
In GA4, you can monitor several important user activities. Here is a list of key activities to track:
- Viewing product
- Adding product to cart
- Login and signup
- Providing payment info
- Purchasing product
- Adding to wishlist
- Removing from cart
- Product search
Tracking and analyzing these activities provide valuable insights into user behavior.
Iterating your business strategies based on these metrics can increase sales and accelerate your business growth.
Do You Want To Monitor These User Activites?
GET FREE ACCESS FOR 30 DAYS
Get detailed reports and insights on user activities. Improve user experience by implementing them.

Event-scoped Metrics Vs Item-scoped Metrics
You can track these activities in two ways: Event-scoped tracking and Item-scoped tracking. Here's the difference between them:
Suppose a user increased the quantity of a product from 1 to 4. In event-scoped tracking, the product quantity increase will be 1, but in item-scoped tracking, the quantity increase will be 3.
Event-based metrics are good enough if you're looking for an overview of data for your online store.
However, if you're going to utilize the data for personalizing customer experiences, improving your store, and running marketing campaigns, then item-scoped metrics are more effective as they provide more in-depth insights into your business.
How To Setup Ecommerce Events In GA4?
You can start ecommerce tracking in GA4 by enabling ecommerce events. The setup process depends on your Google Analytics account configuration and whether you migrated from Universal Analytics.
- If you migrated from Universal Analytics, follow this guide to set up ecommerce events.
- If you used Google Tag Manager to set up Google Analytics, you'll also need to use Google Tag Manager for ecommerce events.
P.S. For specific integrations:
- If your store runs on Shopify, check out GA4's integration with Shopify.
- For WooCommerce, use this guide.
- Etsy users, follow this guide.
- SquareSpace users, use this guide.
Are You Struggling To Set Up Ecommerce Events?
GET FREE ACCESS FOR 30 DAYS
No need to struggle anymore! Choose from our pre-built ecommerce templates and receive all key metrics on autopilot.

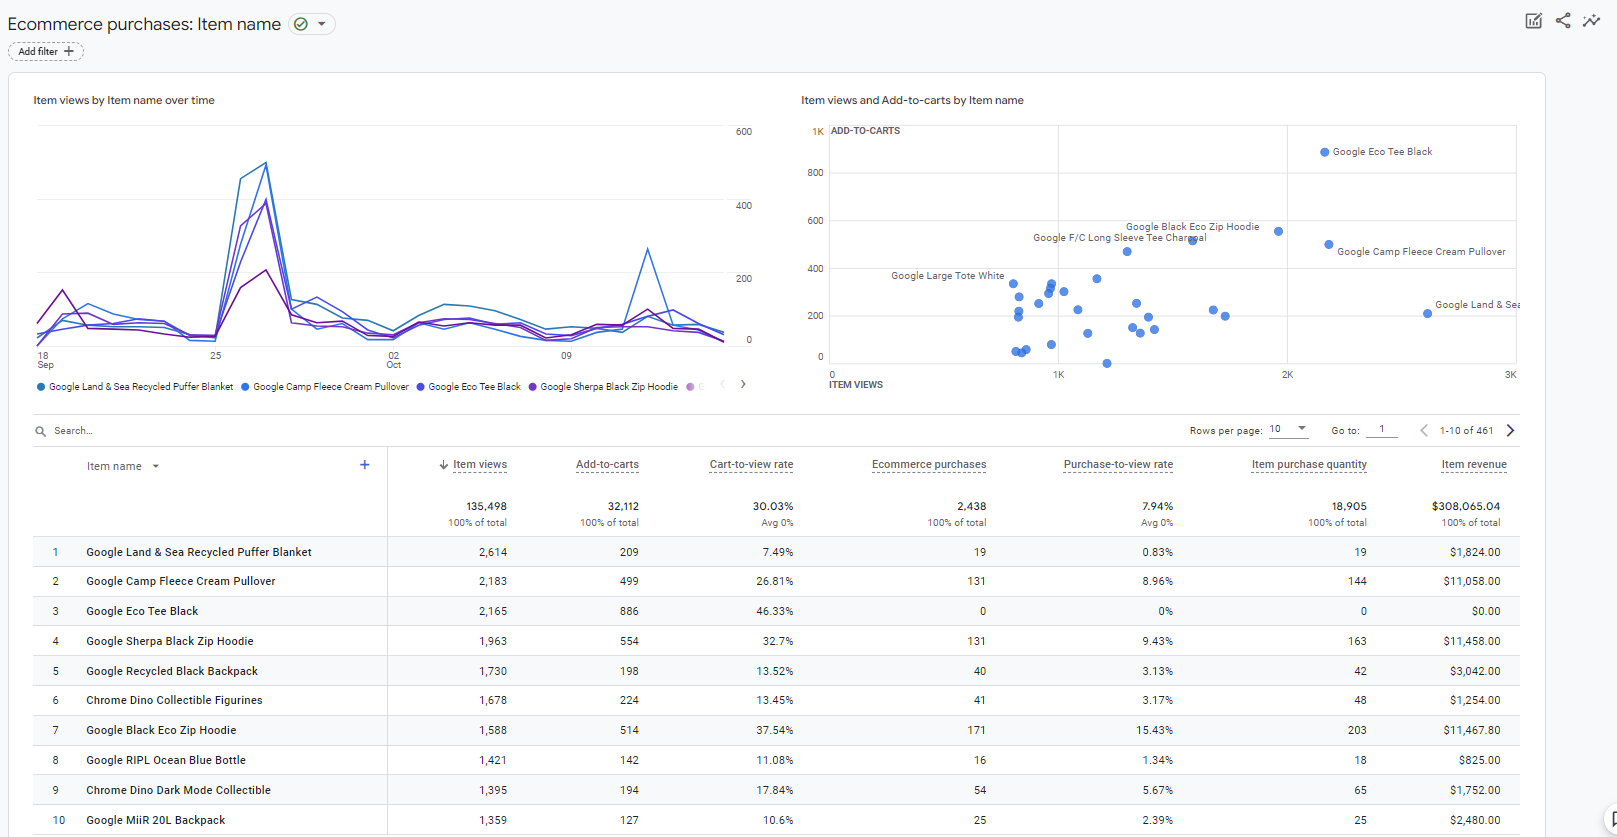
In GA4, you'll find ecommerce data in various places. You can find the purchases report in Reports > Monetization > Ecommerce purchases.
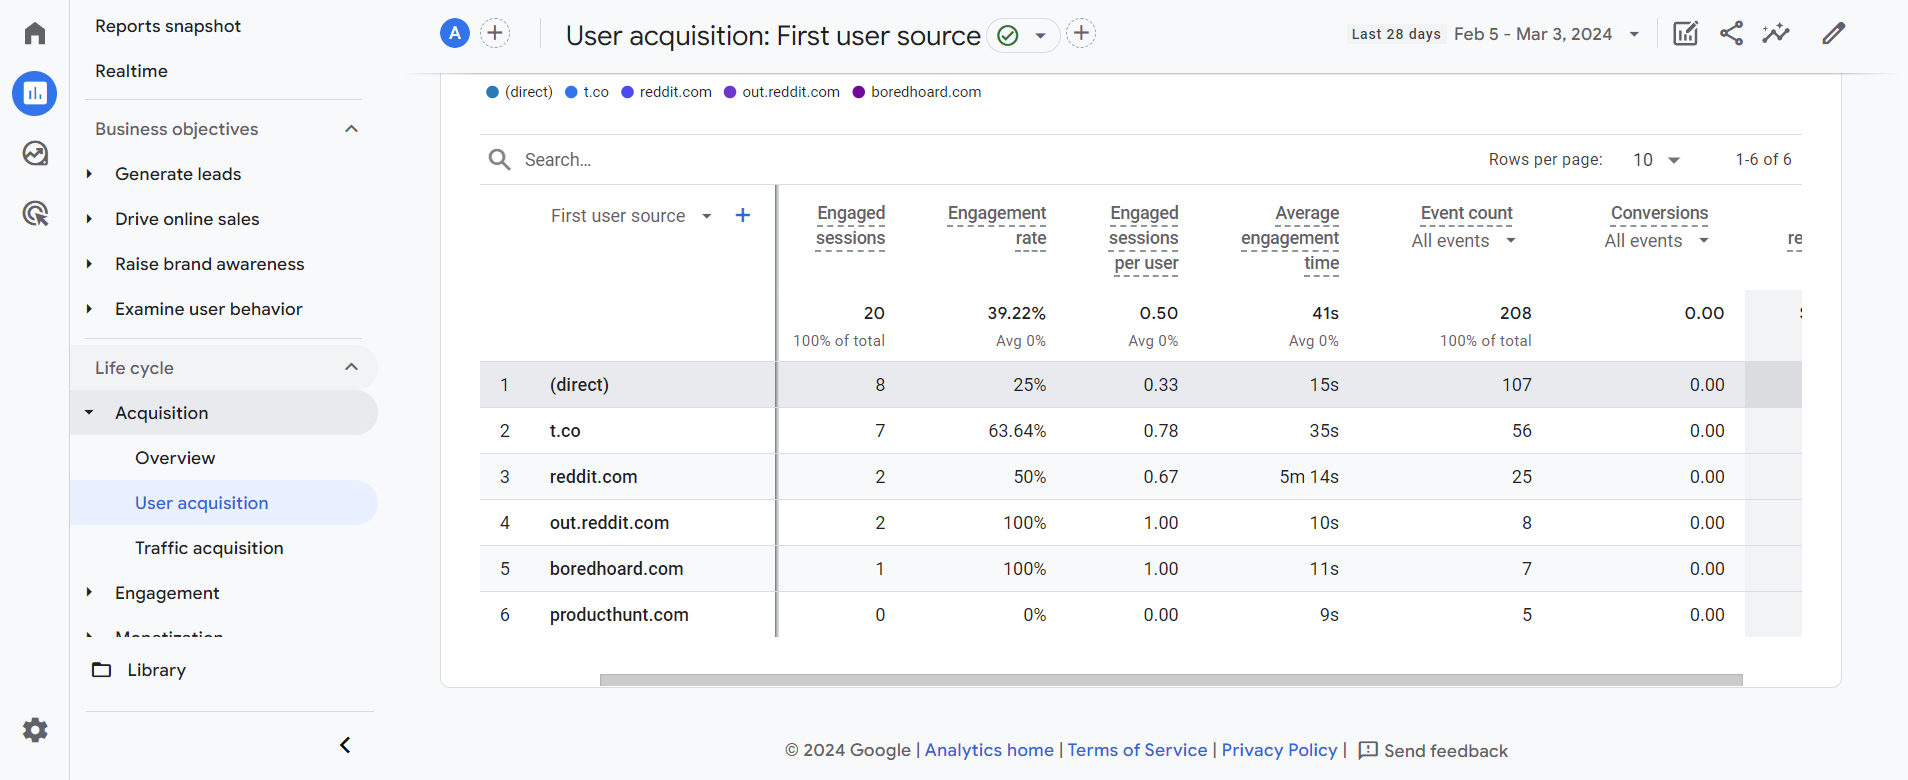
You can also find ecommerce data like conversion rates, revenue for different channels, new user count, and average engagement time in Reports > Acquisition > User acquisition.
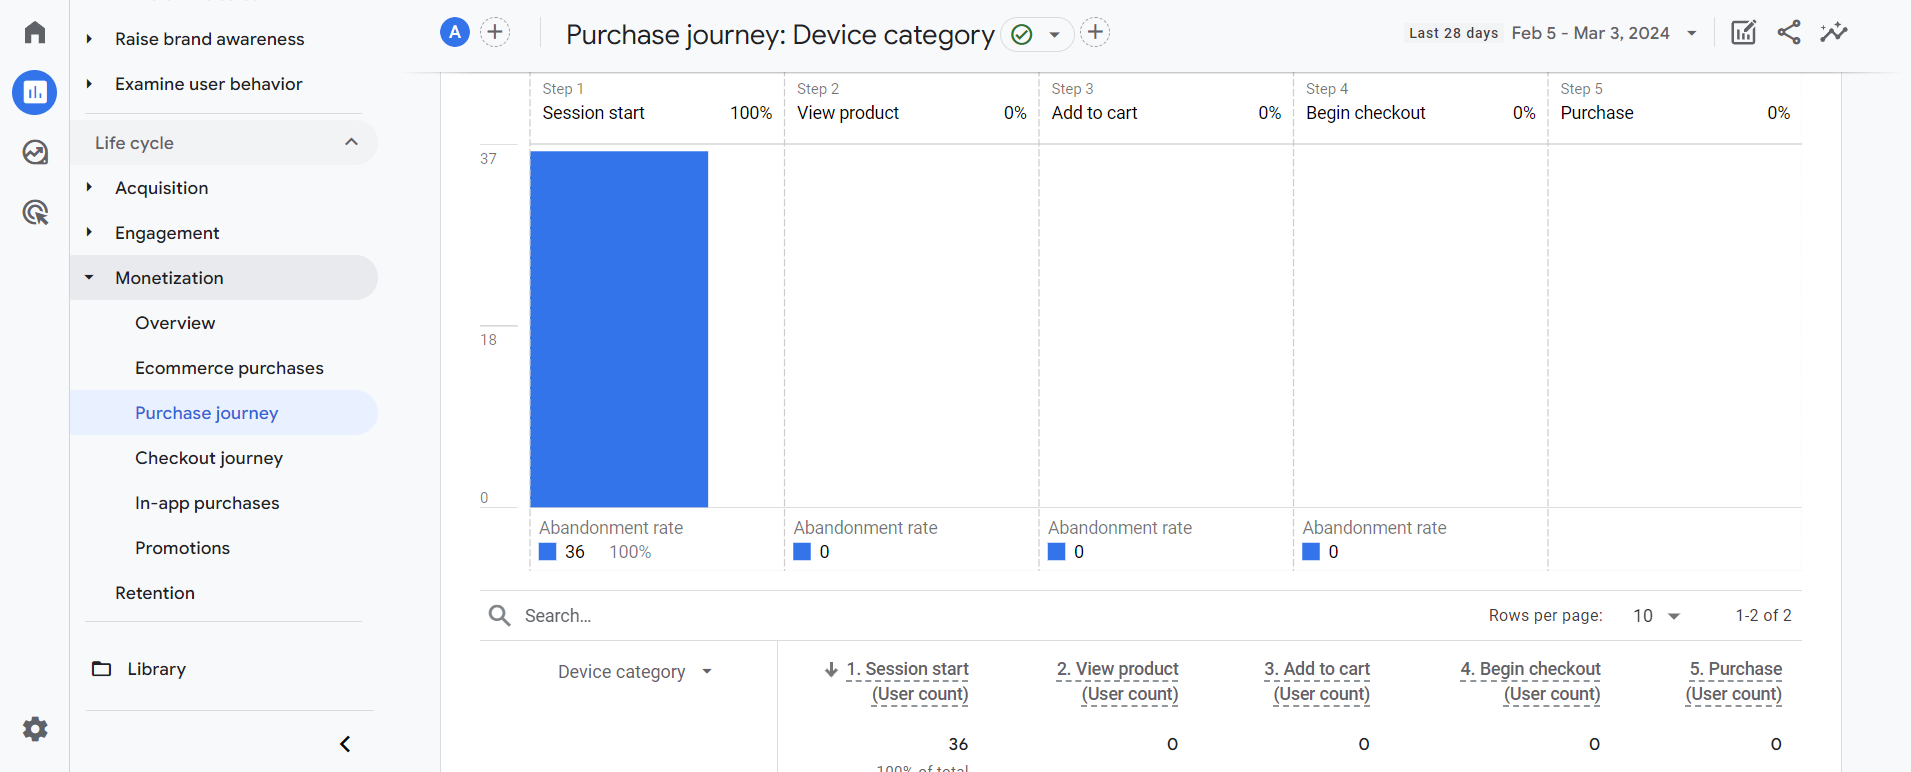
Track users' progress on your store, from the start of their session to viewing products, adding them to the cart, and making a purchase in the Reports > Monetization > Purchase journey report.
7 Key Insights In GA4 For Maximizing Your Ecommerce Success
1. Landing Page Performance
The landing page is a key factor for conversions. Given our shorter attention spans, you have only 10-15 seconds to capture visitors' attention and turn them into potential customers.
When we refer to the landing page, we're not talking about just the home page but any page where traffic is directed.
Driving traffic to an irrelevant page can harm your brand and reduce sales.
To ensure the relevance of the landing page to visitors, confirm that the content you're driving traffic from is relevant to the content on the page.
Check whether users engage or leave the site within the first 20 seconds. A high bounce rate indicates that your content might not be valuable to users.
Are You Struggling With A High Bounce Rate?
GET FREE ACCESS FOR 30 DAYS
Understand why visitors are leaving, fix the issues, and turn visitors into customers.
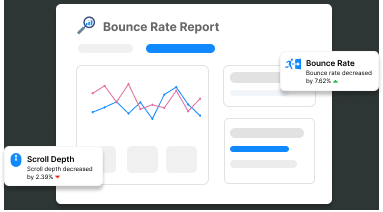
Identify sections that are making users leave. Edit the content of those sections, and test them again.
Continue iterating until you observe a decrease in the bounce rate or an increase in engagement.
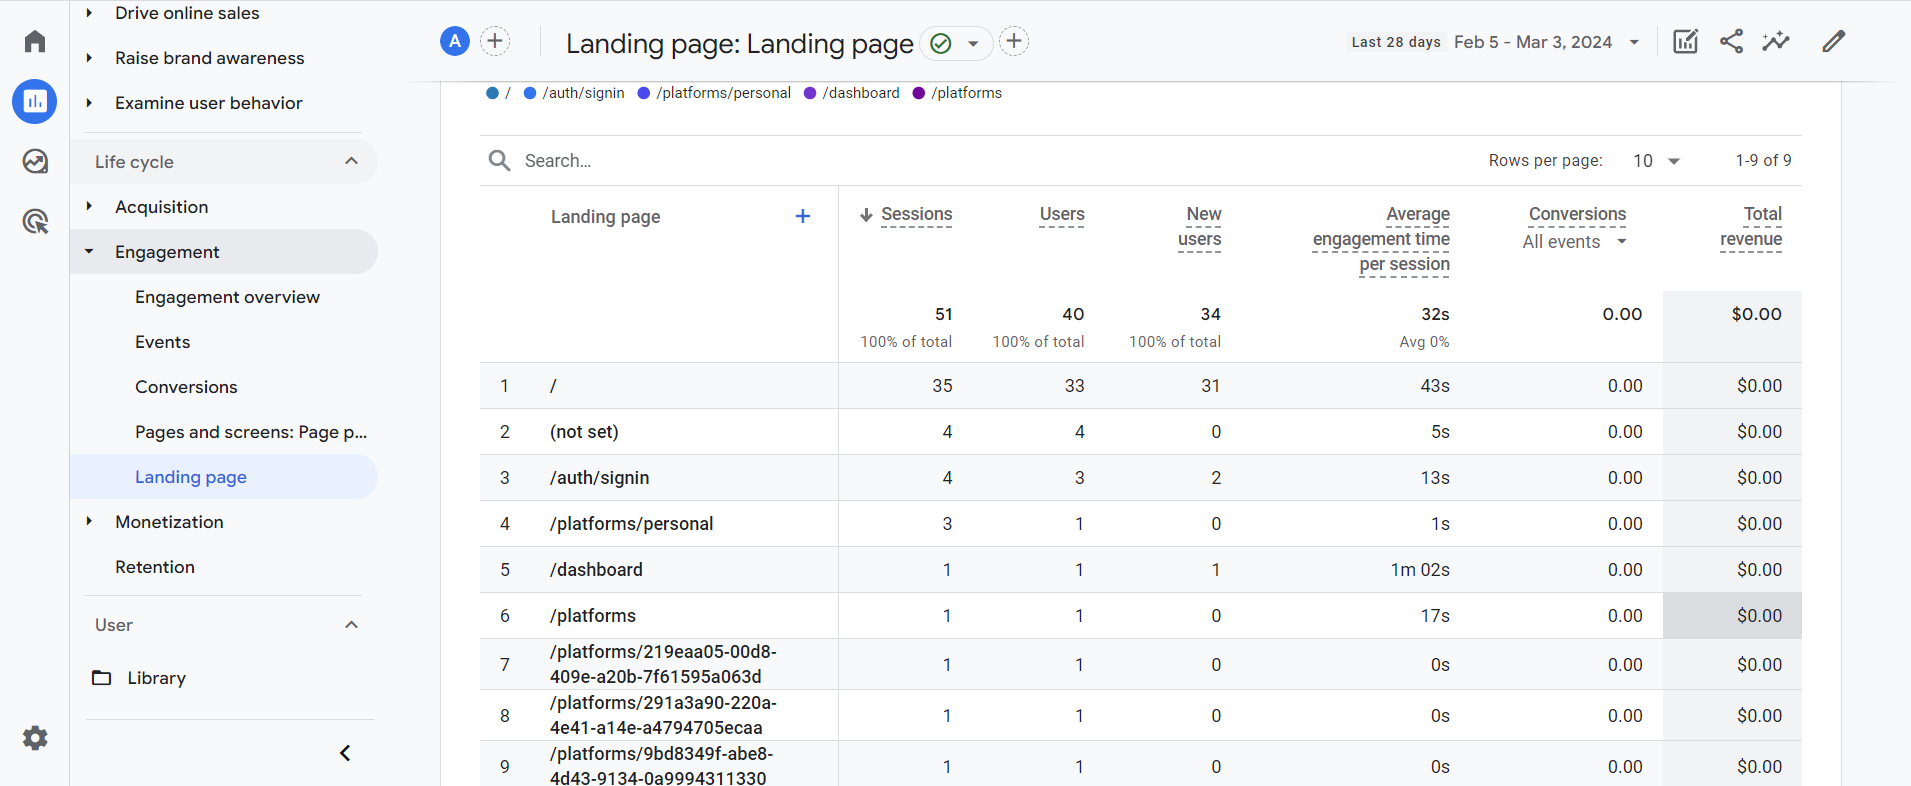
Explore landing page performance here: Reports > Engagement > Landing page
2. Product Performance
When adding new products, rely on data rather than instinct. This approach protects your brand, saves time, and money. It also ensures that you deliver what your customers want.
Want To Know About Your Product Performance?
GET FREE ACCESS FOR 30 DAYS
Receive detailed reports and insights on product performance.
Double down on the best selling products, get rid of the underperforming ones, and achieve a higher ROI.
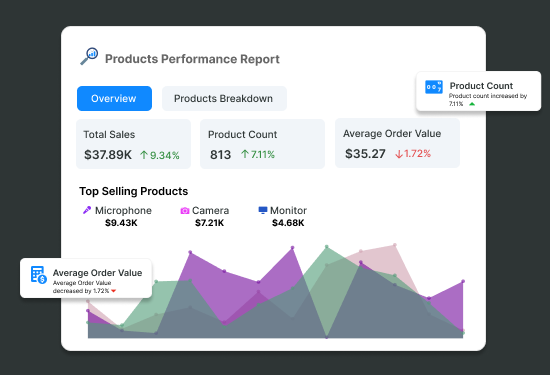
You can find your biggest revenue makers and underperforming products here: Reports > Monetization > Ecommerce purchases.

3. Cart Abandonment Rate
Card abandonment is a common problem faced by every online business, and surprisingly, most businesses tend to overlook it.
Potential reasons behind high cart abandonment rate could include excessive information requests, absence of preferred payment methods, high shipping costs etc.
Pinpointing the precise cause requires a detailed analysis of user behavior and the purchase journey.
Want To Find Out The Reasons Behind Cart Abandonment?
GET FREE ACCESS FOR 30 DAYS
Discover why users abandon their carts, fix the issues, and increase your sales.
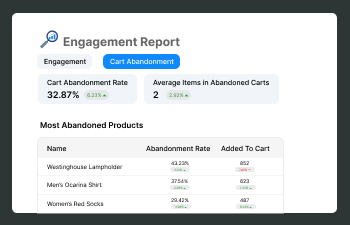
To assess your store's cart abandonment rate, create a funnel report in Explore > Funnel exploration.
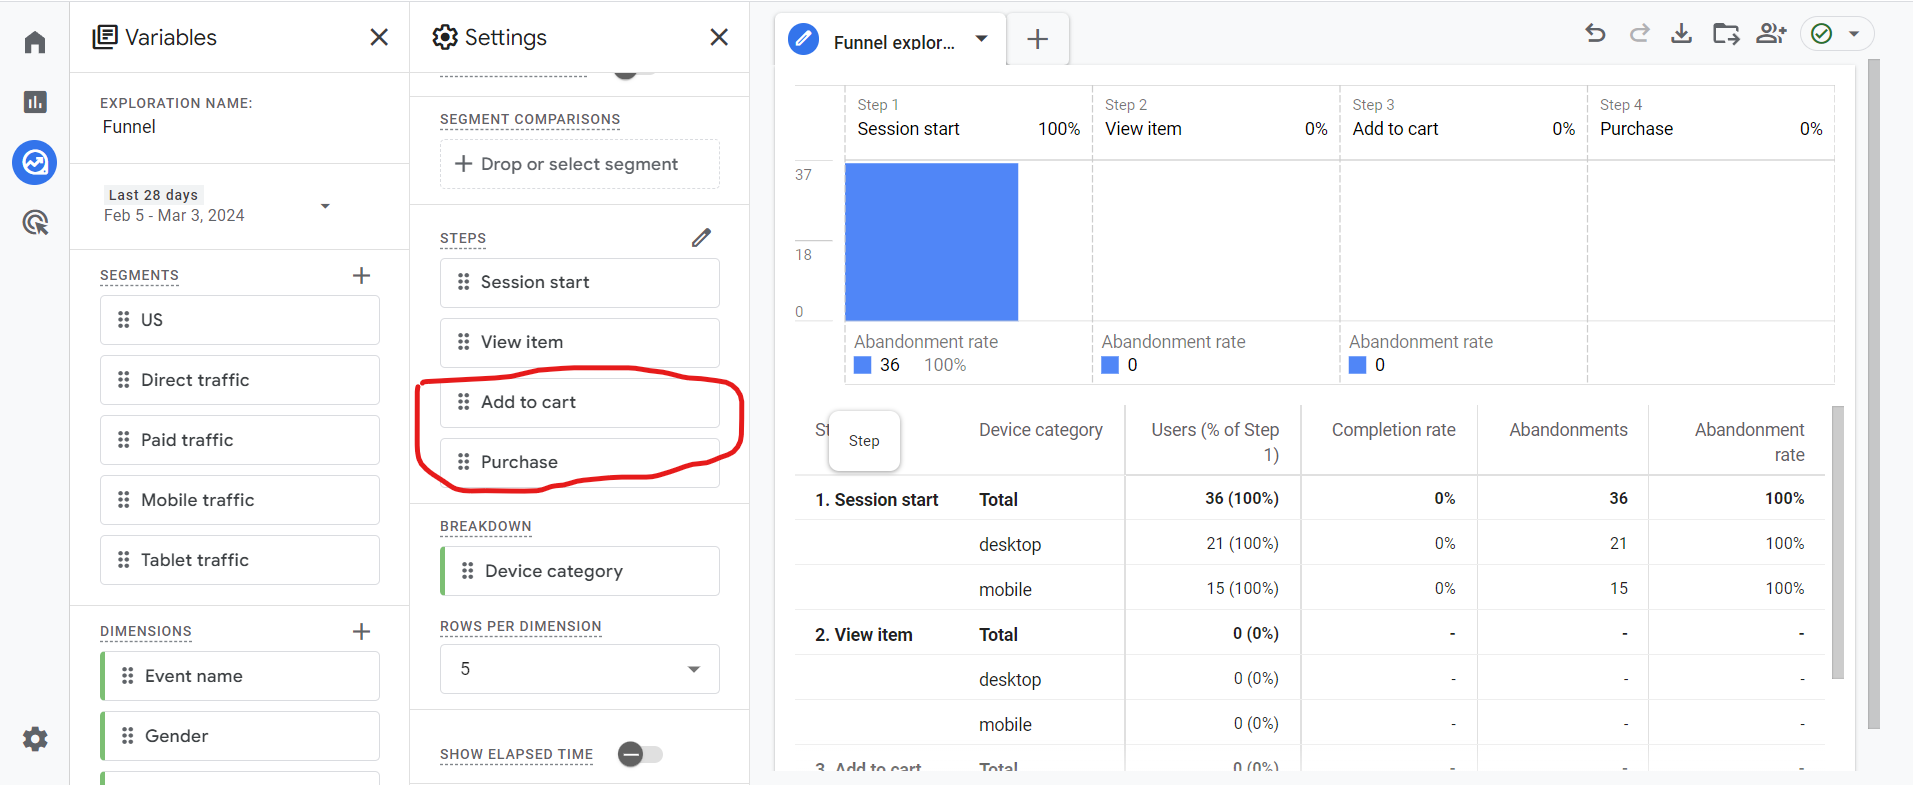
Build the funnel with steps such as 'Session start', 'View item', 'Add to cart', and 'Purchase'. The drop-off between the last two steps is your cart abandonment rate.
4. Sales And Revenue
Sales and revenue are fundamental metrics that every business must monitor. It is important for evaluating your business's performance.
You can find it in the Reports > Monetization > Ecommerce purchases report.

Businesses that ignore tracking sales and revenue have a hard time measuring their growth.
5. High And Low Converting Traffic
Identifying the most converting traffic can help you optimize your marketing strategies and achieve a higher ROI.
To analyze traffic sources, go to Reports > Acquisition > Traffic acquisition. This report provides valuable metrics about the sources that drive the most traffic, engagement, repeat visits, conversions, and revenue.
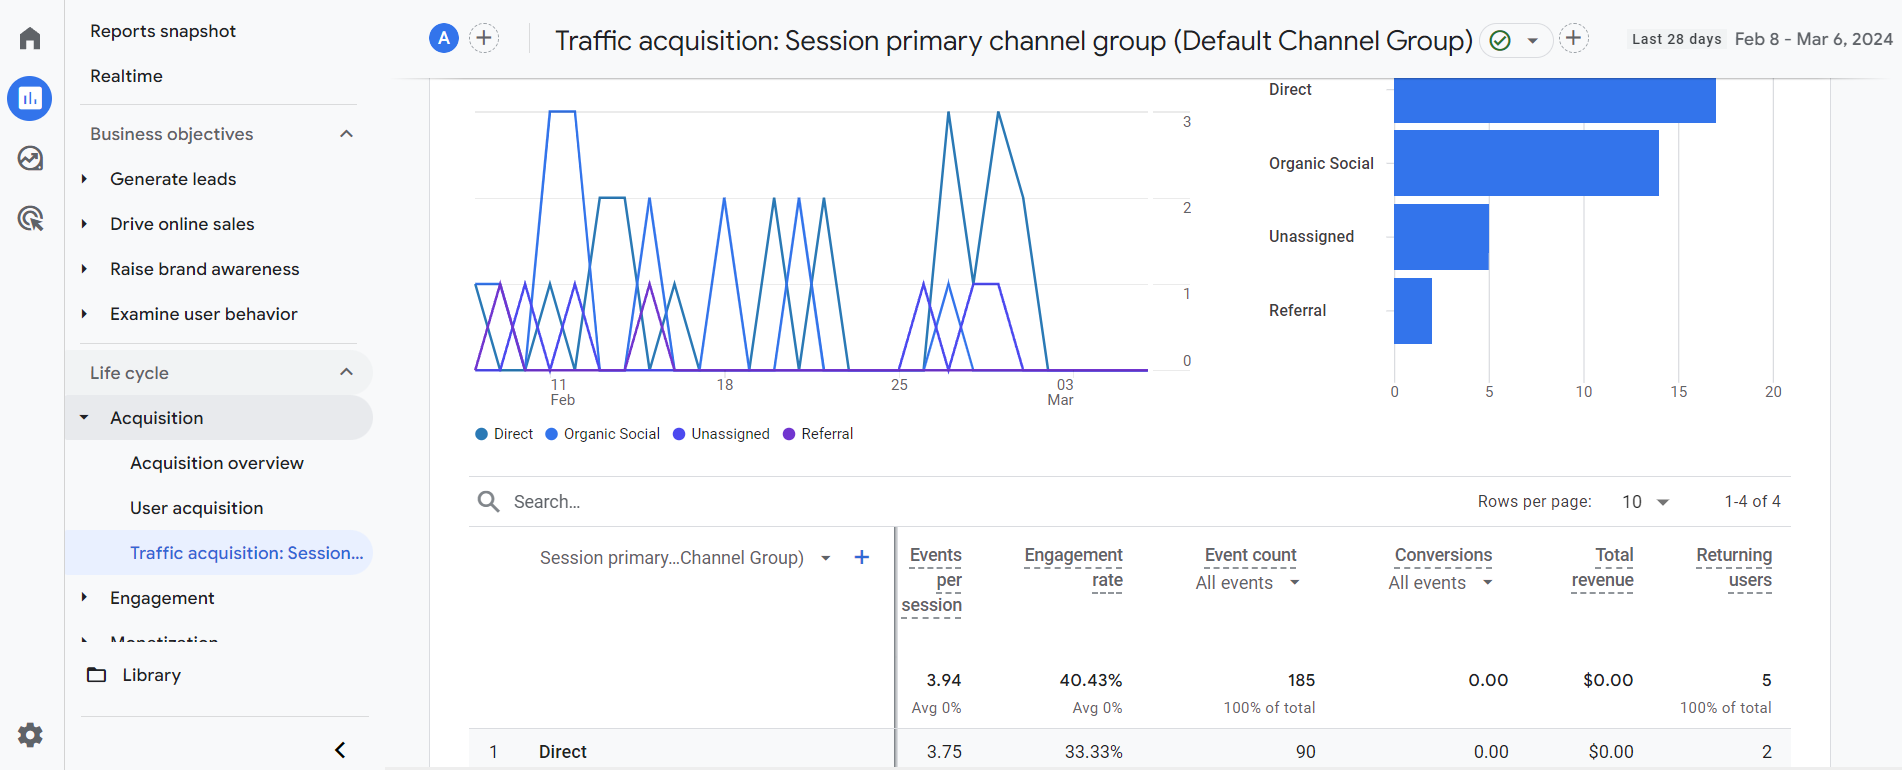
It's also important to track the devices your visitors use to browse your site.
In Reports > Tech > Tech details, you'll find metrics related to users, engagement rates, conversions, and revenue based on devices, browsers, screen resolutions, and operating systems.
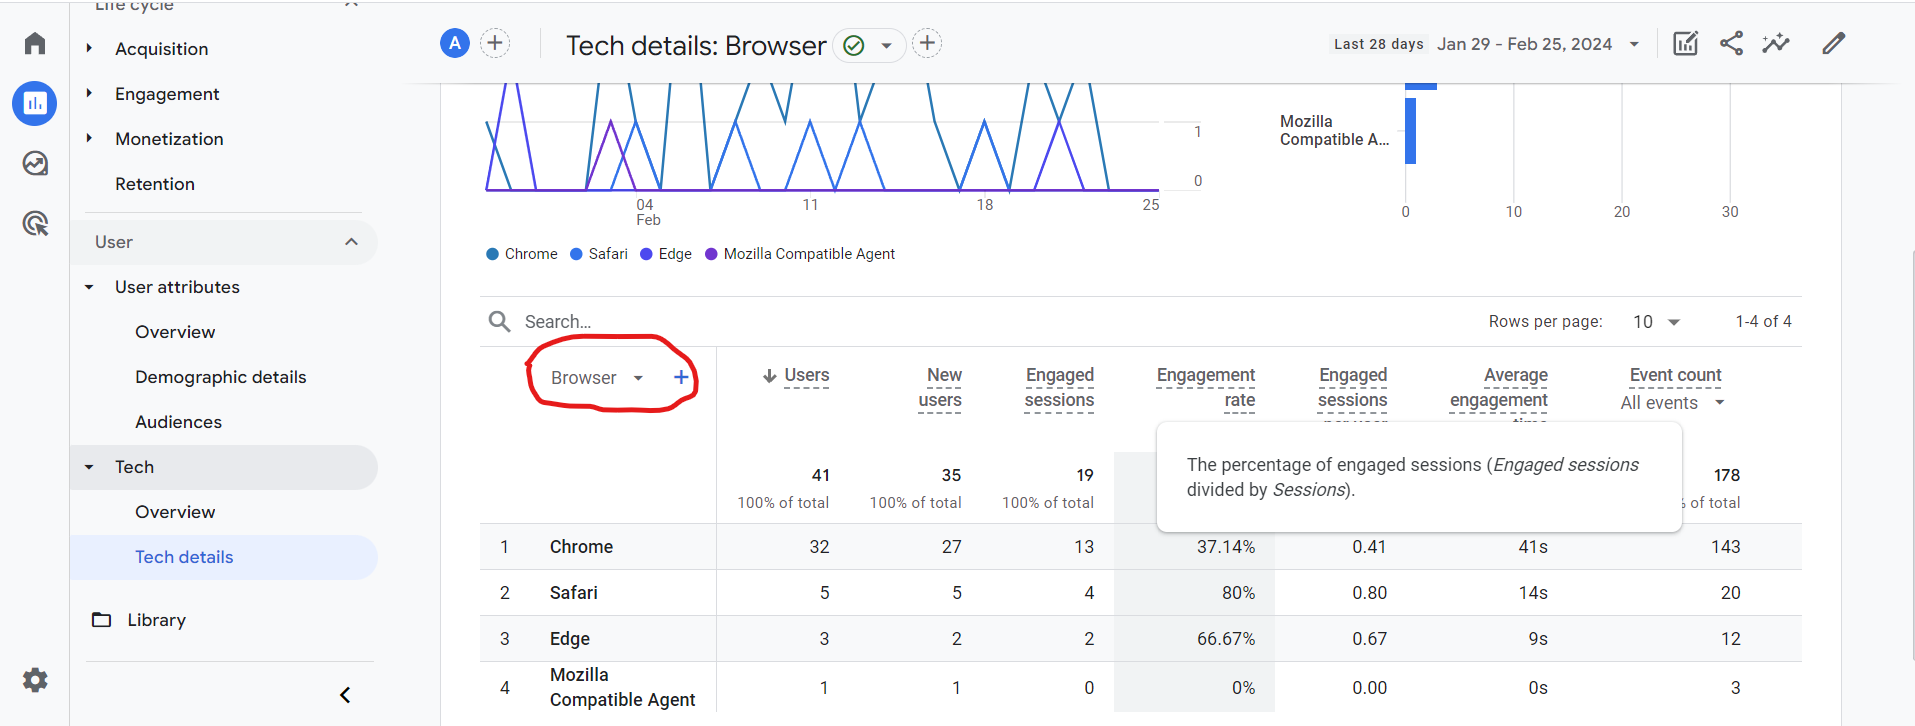
Analyzing user behavior across devices is essential for optimizing your website, improving user experience, and increasing conversion rates.
6. Campaign And Segment Comparison
Analyzing the performance of your marketing campaigns is key for getting a higher ROI. In Google Analytics, you can easily assess the performance of your marketing campaigns.
Utilizing UTM parameters in Google Analytics allows you to monitor the effectiveness of each campaign.
Want To Find Out How Your Marketing Campaigns Are Performing?
GET FREE ACCESS FOR 30 DAYS
Leverage detailed campaign performance reports and key insights to get a higher ROI.
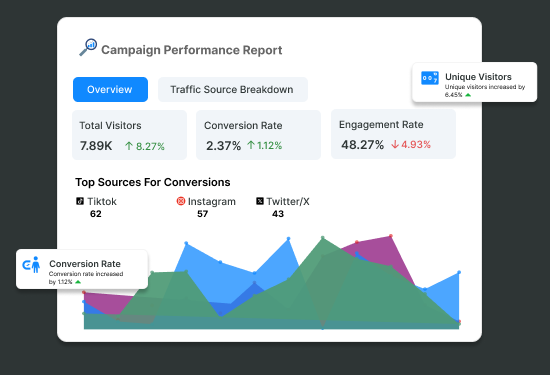
To track the performance of your marketing campaigns in Google Analytics:
- Navigate to Reports > Acquisition > Traffic Acquisition.
- Choose the Session Campaign dimension at the top of the first column. You can also select Session Source/Medium for a clear distinction between channels.
- Use the search bar to filter and compare campaigns with a common denominator, such as the format or channel (e.g., email or newsletter).
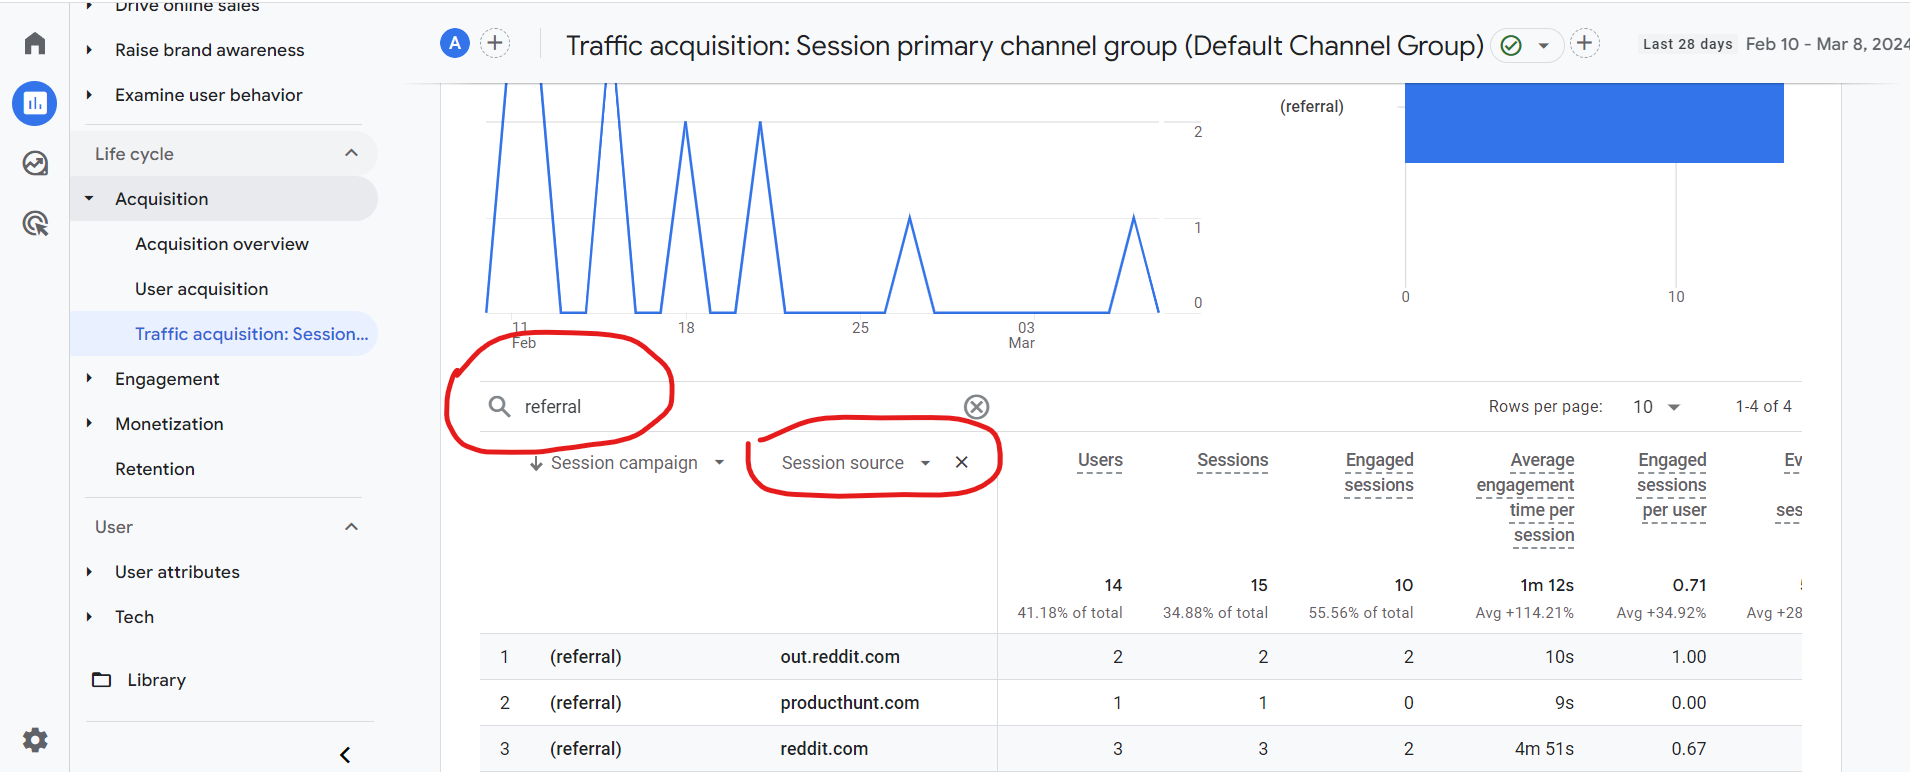
This analysis helps you in identifying the most effective campaigns and doubling down on them.
Creating custom segments based on traffic source, demographics, age, gender, interests, location, engagement rate, bounce rate etc. allow you to personalize your marketing strategy.
Comparing different audience segments further helps you understand your audience better and improves ROI.
Are You Struggling To Create And Compare Custom Segments?
GET FREE ACCESS FOR 30 DAYS
Receive detailed custom segments report and key insights. Compare them to gain a deeper understanding of your audience.
To compare audience segments:
- Access any standard report like: Reports > Acquisition > Acquisition overview
- Click the Add Comparison button at the top.
- Define the conditions for your user segment.
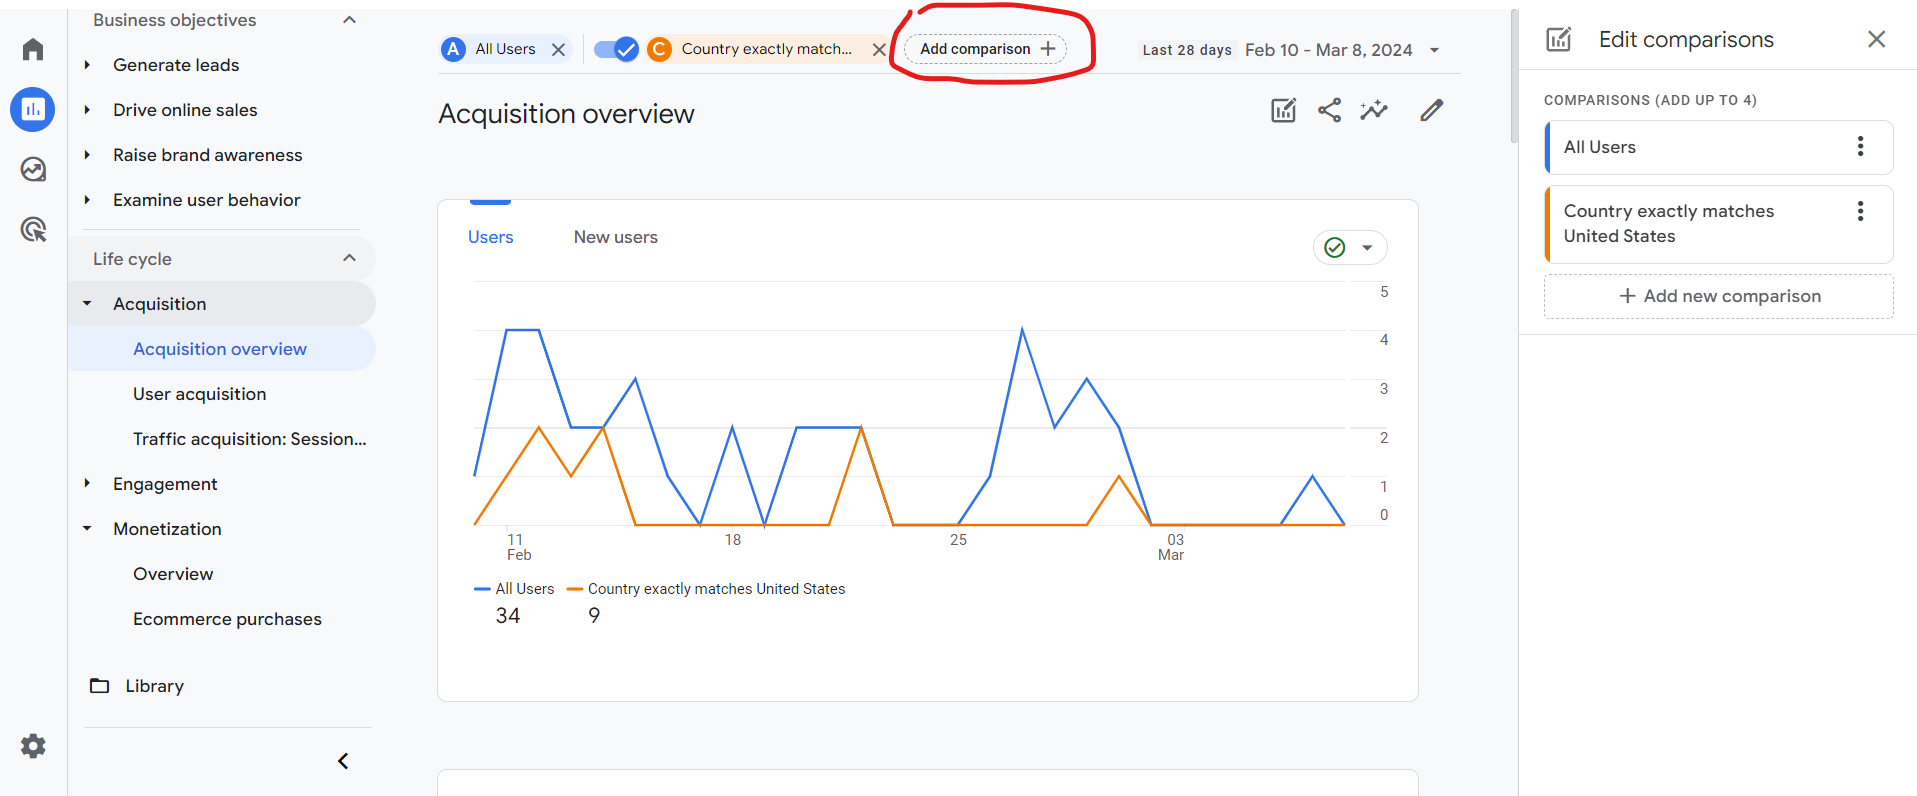
Layering segments on top of other reports, such as campaigns, devices, and landing pages, helps you to refine your products, categories, and emails for a more personalized and improved customer experience.
7. Conversions
Setting up conversions in GA4 is important for assessing your business performance. They provide insights into your business performance on a weekly, monthly, or yearly basis.
To find conversions in GA4 and gain valuable insights:
- Go to Reports > Engagement > Conversions
- Click the Compare option next to the calendar.
- Choose from predefined periods or customize your own for a more detailed analysis.
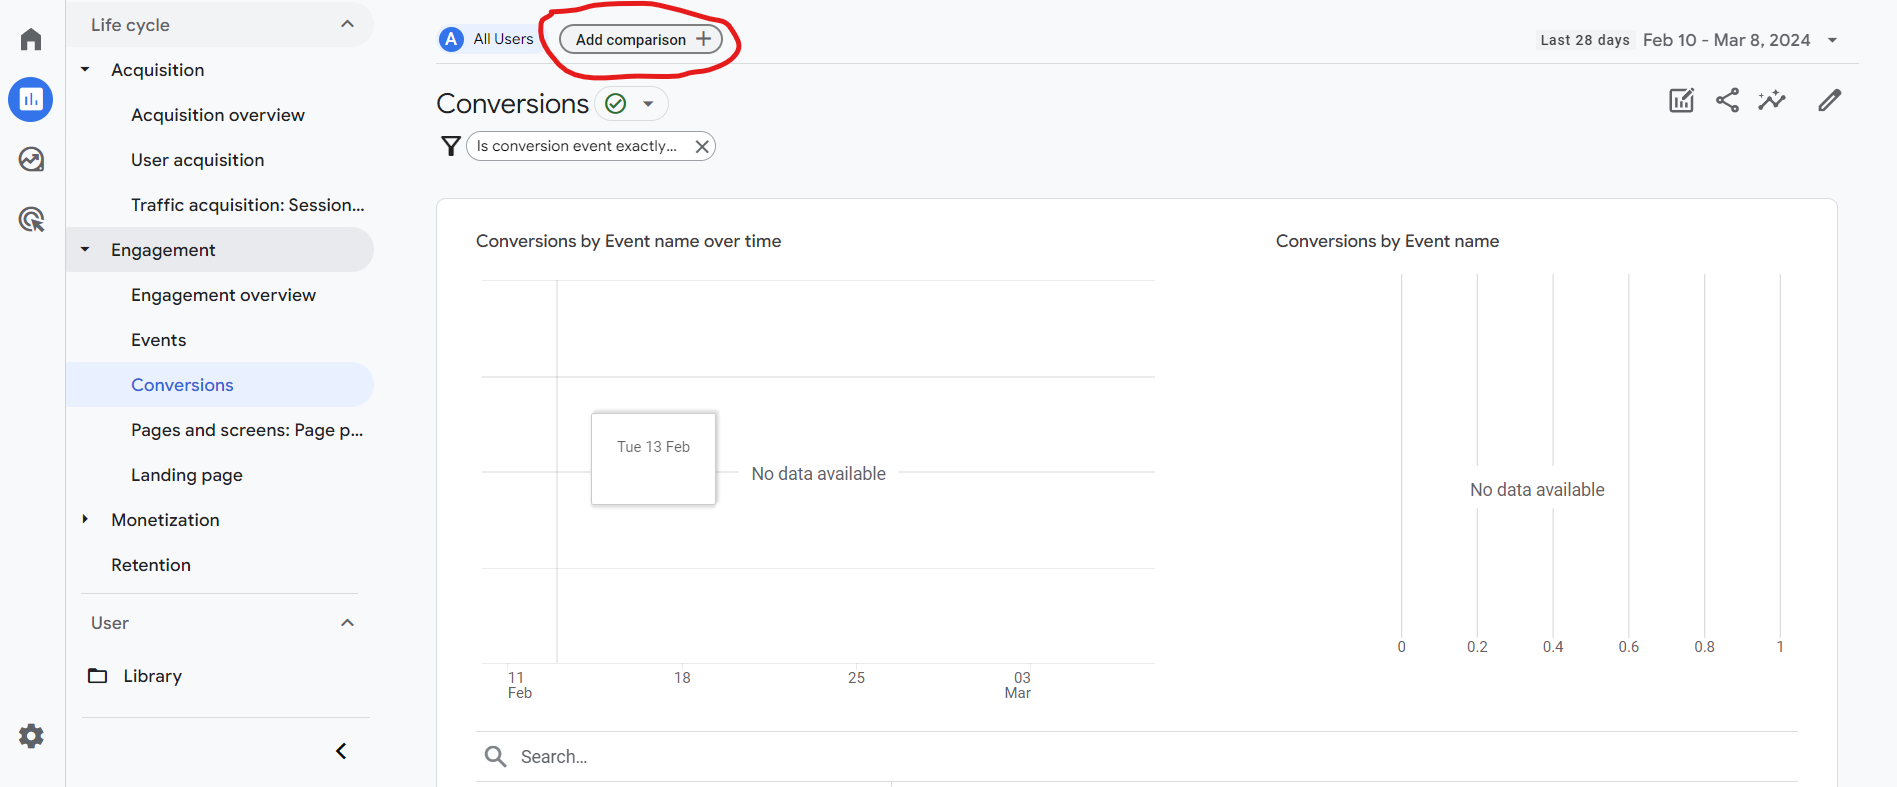
Tracking conversions also allows you to observe changes in key metrics like revenue, cart abandonment rate, and conversion rate over time.
To set up conversions, turn on 'Mark as conversion' for the events you want to assign as conversions in Admin > Data Display > Events.
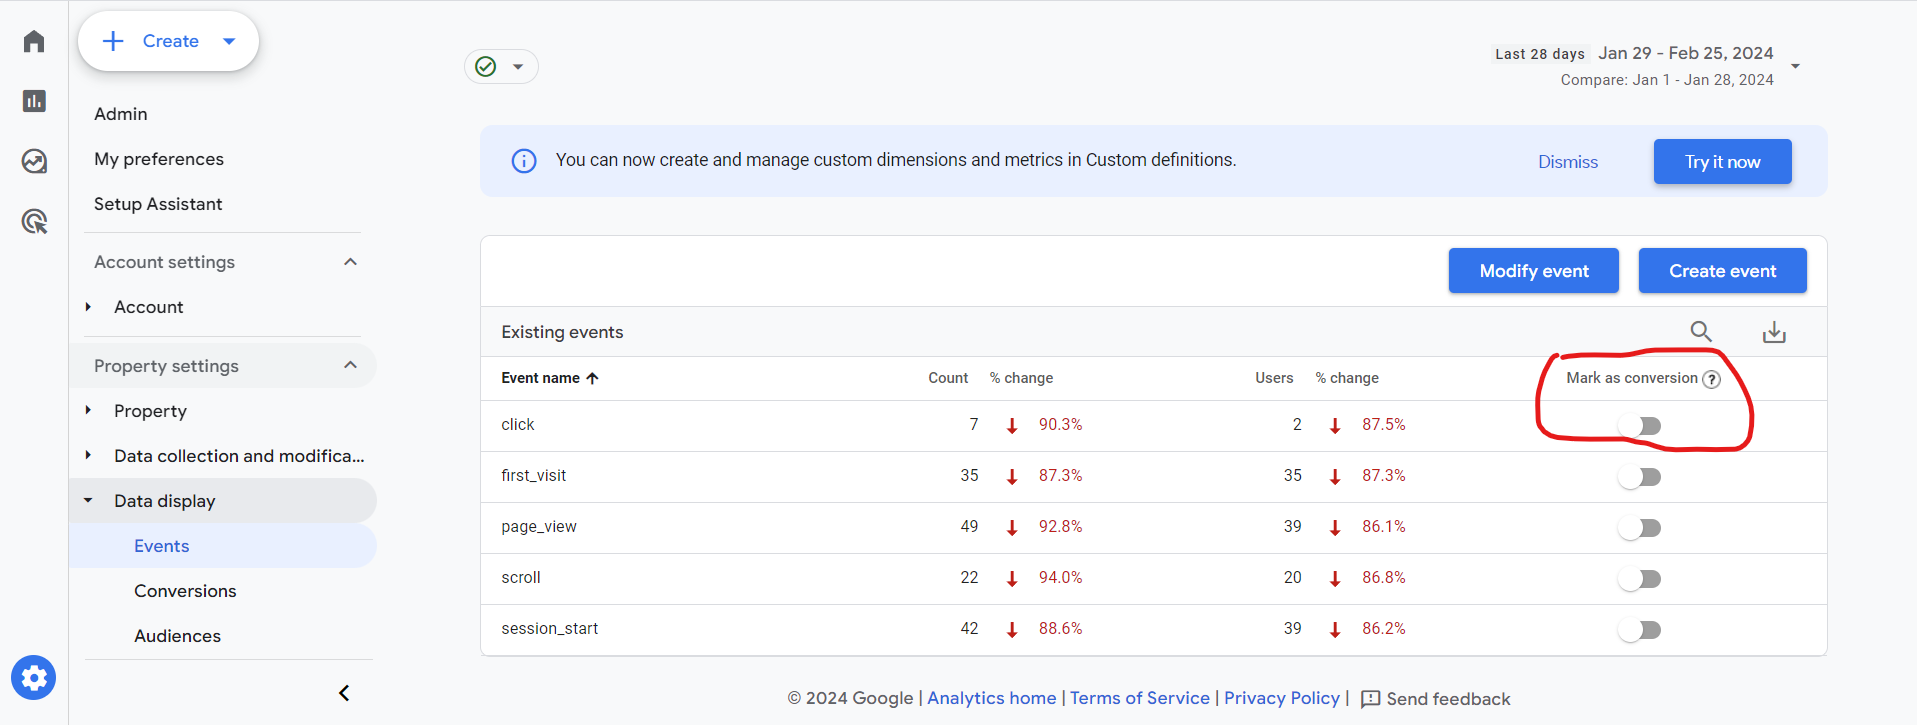
Start tracking conversions in Google Analytics to analyze progress and make informed decisions based on your business objectives.
Conclusion
The eCommerce market is projected to reach US$6.913 trillion in 2024 and US$8.1 trillion by 2028. However, not every business will survive to capitalize on this vast opportunity.
Over 95% of ecommerce businesses fail in the first 3 months because of not leveraging data.
Start ecommerce tracking in Google Analytics(GA4) to stand out from the crowd and tap into this massive market cap.
When are you going to start?